Chinese Growth: A Source of U.S. Export OpportunitiesWilliam Poole*President, Federal Reserve Bank of St. LouisFiscal Affairs & Government Operations CommitteeThe Council of State Governments’ Southern Legislative Conference (SLC)Louisville, KentuckyJuly 31, 2006*I appreciate comments provided by my colleagues at the Federal Reserve Bank of St. Louis. Cletus C. Coughlin, vice president and deputy director of research, provided special assistance. I take full responsibility for errors. The views expressed are mine and do not necessarily reflect official positions of the Federal Reserve System. --------------------------------------------------------------------------------Chinese Growth: A Source of U.S. Export OpportunitiesWith all the press reports about the enormous growth of China’s exports to the United States, I start with a story running in the opposite direction. Kanawha Scales and Systems is a company located in Poca, W.Va., which has a population of roughly 1,000. Chinese purchases of this company’s coal-loading machines have grown to account for about one-third of the company’s $50 million in annual revenues.(1) How many stories are there like the Kanawha Scales one? Well, I’ll share another example. A recent report indicates that a group from Kentucky will be involved in the construction of a thoroughbred racetrack in China, the first in mainland China.(2) As part of this deal, 1,500 Kentucky thoroughbreds will be sold and shipped to China and it is also possible that a number of Chinese will come to Kentucky to learn how to be trainers, exercise riders, jockeys, grooms and hot walkers.Are these isolated examples? Just how important to the United States are sales of U.S. goods and services to China? My purpose this morning is to convince you that the answer to this question is clear. Sales of U.S. goods and services to China are large, are growing and are very important to the United States. In fact, as I’ll detail shortly, firms in the 16 member states of the Southern Legislative Conference are engaged in substantial exporting activity to China. I’ll discuss major features of the economic relationship between the United States and China, but with special emphasis on U.S. exports to China because that critically important part of the relationship is not well understood. Before proceeding, I want to emphasize that the views I express here are mine and do not necessarily reflect official positions of the Federal Reserve System. I thank my colleagues at the Federal Reserve Bank of St. Louis for their comments, particularly Cletus C. Coughlin, vice president and deputy director of research, who provided special assistance. However, I retain full responsibility for errors.Trade ProspectsIncreases in international trade depend on three key factors—income growth, reductions in trade barriers and declines in transportation costs. Income growth has been the most important of these three factors stimulating increased trade worldwide, with reductions in trade barriers a distant second and declines in transportation costs an even more distant third.(3) The direct implication of this research finding is that any discussion of trade flows should begin by examining income growth. In fact, almost without exception over the past 55 years, growth in world merchandise exports has exceeded growth in gross domestic product.(4) (See Figure 1.) It is reasonable, therefore, to anticipate a strong relationship between Chinese growth and U.S. exports, and that’s exactly what we observe. The transformation of the Chinese economy has been accompanied by a huge increase in international trade and capital flows. U.S. exports to China have also been spurred by reductions in Chinese trade barriers, especially as part of China’s entry into the World Trade Organization in 2001. In addition to a substantial decline since 1982 in import tariffs, in 2005 China eliminated the licenses that were required for the importation of many goods. (5)Chinese and U.S. Growth China, with a population in excess of one billion, has maintained an astonishing rate of economic growth over the past 28 years. Beginning in 1978, China embarked on a series of policy changes that have led to an economy increasingly reliant on markets and price signals for allocating productive resources. (6)As of July 2006, the Chinese population was 1.3 billion, which is more than four times as large as the U.S. population of 298 million. In terms of total production, measured in dollars at purchasing power parity, the Chinese economy is the world’s second largest economy, trailing only the United States. In 2005, the Chinese GDP exceeded $8 trillion, which was roughly two-thirds the U.S. GDP. (See Figure 2.) Not surprisingly, these two countries were two of the three leading exporting and importing countries in the world. (7)(See Figure 3.)The most vivid illustration of rapid Chinese growth can be seen by examining the Chinese economy on a per capita basis. Adjusted for inflation, China’s per capita GDP in 2004 was 6.6 times its 1980 level. (See Figure 4.) Annual growth rates of real per capita GDP in excess of five percent have been the norm in recent years. (See Figure 5.) In the late 1970s China’s real GDP per capita was slightly less than 5 percent of the U.S. level. Today it exceeds 10 percent. (See Figure 6.) Thus, although the overall Chinese economy is large, China is still a country with a relatively low level of per capita income. To provide perspective, China’s real per capita GDP today is about equal to U.S. per capita GDP in 1886.Theory of Integrating a Large Labor-Abundant Country into the World EconomySome basic economic theory will provide a foundation for viewing the integration of the Chinese economy into the world economy. The analysis applies not only to the integration of the Chinese economy but also to similar developments that are occurring simultaneously in India and the countries of the former Soviet Union.(8) Economists view the integration of these economies into the global economy as a labor “shock.” Their integration can be viewed as a very large increase in the world’s effective labor supply. To facilitate my discussion, assume that the bulk of this increase in the labor supply in recent years has tended to be low-skilled. Employing this simplifying assumption, two consequences are a direct result of the increased supply of low-skilled labor. One is that wages of low-skilled labor in high-income countries will tend to fall, or to increase more slowly than before China’s entry to the world trading system. Second, prices of those goods that require relatively large amounts of low-skilled labor should tend to decline relative to the prices of those goods that require relatively large amounts of high-skilled labor. For convenience of exposition, I’ll refer to goods produced with low-skilled labor as “low-tech” goods and goods produced with high-skilled labor as “high-tech goods.” Obviously, there is a continuum of goods from low to high tech but the simplification will make it easy to understand the basic economic forces at work.The first effect tends to depress income gains of low-skilled labor in high-income countries. Obviously, the share in total population of high-skilled workers is greater in high-income countries than in low-income countries. Because of the large increase in low-skilled workers worldwide, low-skilled workers in the United States are likely to experience downward pressure on their real wages due to the increased competition associated with Chinese exports.(9) The adverse income change generates demands for a government response to ameliorate the adverse market change. The problem is real: Low-skilled workers in the United States have been adversely affected by imports of goods produced by low-skilled workers abroad. However, the nature of the government response is very important. Trade restrictions that hinder the importation of goods from China are unlikely to be a good solution because the United States would simply be foregoing the benefits of Chinese imports. Indeed, those lower priced goods are important to lower-income, working families in the United States. The only appealing solution for the United States as a whole is to adopt policies that will increase the skill levels of affected workers, so that they can increase their compensation and employment prospects, which will allow them to adjust to the evolving economic environment. Now consider the effect tending to reduce the prices of goods made with low-skilled labor. This relative price change, in which low-tech goods decline in price relative to high-tech goods, is associated with two other important price changes. The first involves a country’s terms of trade, which is the (average) price of a country’s exports relative to the (average) price of its imports. In the case of China, the prices of the goods that China ships to the rest of the world should tend to decline relative to the prices of goods that it buys from the rest of the world. Generally speaking, as the price of Chinese exports declines relative to the price of its imports, countries purchasing Chinese goods should become better off. In theory, the more dissimilar another country’s production and consumption is to China, the more likely the country is to benefit by China’s integration into the world economy. Thus, a country such as the United States should tend to benefit from China’s integration. Of course, the magnitude of the gains for the United States depends on the impact of Chinese exports on U.S. import prices. Recent research by staff economists at the Board of Governors of the Federal Reserve System found that Chinese exports have caused declines, albeit small, in U.S. import prices.(10,11) The public-policy challenge is considerable, however, because gains for the United States as a whole are accompanied by downward pressure on wages of U.S. low-skilled workers, as already noted.There is another change that reduces and possibly negates the net benefits for the United States. Coinciding with China’s rapid growth have been substantial increases in China’s imports of commodities such as oil. In fact, China has become the world’s second largest consumer of oil. Chinese demand for oil has undoubtedly contributed to higher oil prices. Given the scale of U.S. oil imports, higher oil prices have certainly reduced the beneficial effects for the United States of recent developments in China.(12) How Chinese Growth Affects Trade The preceding discussion has focused on the relative-price impacts of China’s integration into the world economy. Changes in relative prices, however, are not the only spur to changes in economic activity. China’s economy has reached such a size that in recent years it has served as an engine of growth not only in Asia but also worldwide. Put simply, a wealthier China means rising Chinese demand for goods of all sorts, including high-tech goods that China does not produce.One manifestation of this fact is that Chinese growth has resulted in large effects on overall trade flows. The integration of the Chinese economy into the world economy can be seen very clearly by examining how Chinese exports and imports have changed since the late 1970s. In 1979 Chinese exports as a share of Chinese GDP was 5 percent. Since then the share has risen to 36 percent. (See Figure 7.) The course of Chinese imports has taken a similar path rising from roughly 6 percent of GDP in 1979 to 34 percent in 2005. These import and export shares may be compared with the shares for the United States: Imports are 16 percent of U.S. GDP and exports are 10 percent. As Chinese exports have grown faster than its imports, the Chinese trade balance has increased. A close look at China’s trade balance reveals that from 1979 to the mid-1990s, the average yearly balance was roughly zero. (See Figure 8.) Since the mid-1990s, the balance has tended to rise, reaching a level of $102 billion in 2005, which is 4.4 percent of China’s GDP.U.S.-China TradeThe increase of China’s trade surplus since the mid-1990s coincides with a substantial increase in the U.S.-China bilateral trade balance. In 1995, the U.S. bilateral trade deficit with China was approximately $20 billion. (See Figure 9.) Subsequently, this deficit has increased yearly, reaching $202 billion for 2005, which was 28 percent of the overall U.S. trade deficit. (See Figure 10.) Surprisingly, in 1995 China’s share of the overall U.S. trade deficit was actually larger, at 35 percent.Obviously, since 1995 the growth of U.S. imports from China has exceeded the growth of U.S. exports to China. Between 1995 and 2005, U.S. imports from China increased more than fivefold, while U.S. exports to China increased by a factor of 3.6. (See Figure 11.) But note this important fact: The growth in U.S. exports to China has been far greater than the growth of U.S. exports overall. Between 1995 and 2005, total U.S. exports increased by a factor of 1.6, which is less than half the rate of increase of U.S. exports to China. In light of the rapid Chinese growth, it is not surprising that U.S. exports to China rose rapidly. It is especially noteworthy that in 1995 China was the 13th leading export market for goods produced in the United States and in 2005 it was the 4th leading export market. Put simply, a wealthier China is a better market for U.S. goods and services, especially for high-tech and agricultural goods which the United States produces in abundance.Chinese purchases of U.S. goods took center stage during President Hu Jintao’s visit to the United States last May. During the visit President Hu agreed that China would buy $16.2 billion worth of Boeing jets and various other goods, such as networking equipment, medical devices and beef. A close look at the top ten exporting industries to China in 2005 reveals that the industry code including aircraft was the third leading export industry and that the industry code including medical devices was the fourth leading export industry. (See Table 1.) The two leading industry codes were, first, electrical machinery and equipment and, second, nuclear reactors, boilers, machinery and mechanical appliances. Together, these industries accounted for 31.5 percent of U.S. exports to China.Large multinational corporations play a major role in U.S. exports to China. However, according to the U.S. Commercial Service, since 1992 the number of small and midsize exporters has increased from 3,143 to 19,201, a gain of 511 percent.(13) I opened my remarks today with an example of exports sales by Kanawha Scales and Systems. This same phenomenon of small firms selling to the Chinese market is found all over the United States. Consider Sharpe Mixers of Seattle. This firm makes specialized “absorbers mixers” that strip sulfur dioxide from power plant emissions. Chinese power plant construction is proceeding rapidly to meet large increases in power demand. Most of these power plants are coal-fired and Sharpe has seen its Chinese business increase substantially since receiving its first order in 2004. This additional business has led to ten additional employees for a total of 30.Exports from SLC Member StatesLet’s look more closely at the total exports from the SLC states to China. It turns out that the two leading export sectors are the same as for the United States as a whole. Together, these industries—electrical machinery and equipment and nuclear reactors, boilers, machinery, and mechanical appliances—accounted for 25 percent of the SLC states’ exports to China during 2005.Looking at the SLC states individually, we see substantial differences in their exports to China. Electrical machinery and equipment is the leading export category for only two states—Texas and South Carolina—while nuclear reactors, boilers, machinery and mechanical appliances is the leading export category for four states—North Carolina, Missouri, Maryland and Oklahoma. (See Table 2.) For the remaining ten states various commodity codes appear: plastic products for Alabama and West Virginia, oil seeds for Louisiana, cotton for Tennessee, wood pulp for Georgia, base metals for Virginia, iron and steel products for Kentucky, fertilizers for Florida, vehicles and parts for Mississippi, and inorganic chemicals for Arkansas. For these states, 2005 exports to China range from $4.9 billion from Texas to $0.1 billion from Oklahoma. One fact is that, for SLC states, exports to China relative to gross state product tend to be below the national average for all states together. Using figures for 2005, only four of the 16 SLC states had shares in excess of the national average of 0.36 percent. Those states were Louisiana (1.1), Tennessee (0.62), Texas (0.50) and South Carolina (0.45).What is especially encouraging, however, is that firms in the SLC states have played a key role in the growth of exports to China. Comparing 2002 with 2005, total U.S. exports to China increased by a factor of 1.9. However, 13 of the 16 states represented at this meeting experienced export growth faster than the national average. The leader was Tennessee whose exports increased by a factor of 4.2. Missouri was the second leading state, with exports to China increasing by a factor of 3.9. The only states lagging the national average were Mississippi (1.2), Florida (1.0) and West Virginia (0.9) ConclusionMy message for you today can be summarized very succinctly: The growth of the Chinese economy has provided and will almost certainly continue to provide U.S. firms with important export opportunities. This growing demand for U.S. goods and services provides not only more but also better-paying employment opportunities.This simple message is easy to miss because the continuing integration of China into the world economy presents both political and economic challenges. It is still very easy to identify numerous factors that hinder the sales of goods and services to China by U.S. firms.(14) Without question, Chinese infringement of intellectual property rights remains a problem that limits U.S. exports. In addition, government procurement policies, restrictions involving the wholesale and retail distribution of foreign products in China, and the lack of transparency of many regulations also limit U.S. exports. As I look to the future, I continue to see much negotiation between the China and U.S. governments, as well as many adjustments to the changing economic and political environment by U.S. firms and consumers. Political pressures will continue to be felt by U.S. policymakers. Given the insights from economic theory as well as the lessons of economic history, my hope is that policymakers will resist the calls for isolationist responses. U.S. trade restrictions are highly unlikely to increase employment opportunities at home, but clearly would deprive American consumers of lower-cost goods from China. The best course of action is to continue to encourage China to protect intellectual property rights and to lower barriers on trade. Taking advantage of the opportunities presented by Chinese growth rather than simply attempting to negate the competitive pressures is in the best interest of both countries. Opportunities to increase exports are in fact being seized by U.S. firms, many of which are located in the 16 states served by the Southern Legislative Conference. Recent export growth by nearly all of these states has exceeded the national average. In light of the continuing strong Chinese growth prospects, prospects for exports to China from the states represented here today are very bright.I’ll finish with a general comment. For over 70 years, since the Reciprocal Trade Agreements Act of 1934, the United States has led the way toward a more open international trading system and I am hopeful that this historic process will continue. Both economic theory and economic history have provided ample reasons showing that changes in legislation and regulation that tilt toward economic isolation are unwise. Our future prosperity depends on continuing to build on past successes in extending open markets and enjoying the fruits of the productivity advances open markets promote. FootnotesSee http://www.usatoday.com/money/world/2006-04-19-china-exports-usat_x.htm. See http://charlotte.bizjournals.com/charlotte/stories/2006/03/20/story6.html. See Baier and Bergstrand (2001). Trade barriers and transportation costs are key components of trade costs, which are discussed in detail by Anderson and van Wincoop (2004). Using annual data from the World Trade Organization’s International Trade Statistics 2005, world merchandise export growth exceeded world gross domestic product growth in all but eight years between 1950 and 2004. See “Building Explosion in China Pumps Up Exports from USA,” a web article at http://www.usatoday.com/money/world/2006-04-19-china-exports-usat_x.htm in USA Today. Prasad and Rajan (2006) estimate that between one-half and two-thirds of the Chinese economy is currently market-based. For 2004, the leading countries in terms of total world exports were Germany with a 10.0 percent share, the United States with an 8.9 percent share and China with a 6.5 percent share. In terms of imports, the leading countries were the United States with a 16.1 percent share, Germany with a 7.6 percent share and China with a 5.9 percent share. This idea has been expressed by Wolf (2006). In fact, declining real compensation for low-skilled workers has been an issue for many years in the United States. See Kamin, Marazzi and Schindler (2006). Rodrik (2006) argues that China’s export bundle is more sophisticated than other countries with similar per capita incomes. While labor-intensive exports, such as toys, clothing, and electronics products that entail simple assembly operations, are important in China’s export basket, Rodrik argues that foreign investment has played a major role in the evolution of Chinese exports. Foreign investors dominate Chinese exports. Their contribution of advanced technology, and the resulting transfer of technology, has resulted in Chinese exports that are relatively more sophisticated than comparably developed countries. Not surprisingly, oil is at the center of a contentious political issue. China’s desire for increased oil supplies has led to relationships with a number of countries, such as Sudan and Uzbekistan, which many view as unsavory in terms of their records on human rights. See http://www.usatoday.com/money/world/2006-04-19-china-exports-usat_x.htm. E. Anthony Wayne, Assistant Secretary for Economic and Business Affairs in the U.S. Department of State, enumerated many of the contentious issues in a speech on May 25, 2005, at the Executives’ Club of Chicago. ReferencesAnderson, James E. and van Wincoop, Eric. “Trade Costs.” Journal of Economic Literature, September 2004, 42(3), pp. 691-751.Baier, Scott L. and Bergstrand, Jeffrey H. “The Growth of World Trade: Tariffs, Transport Costs, and Income Similarity.” Journal of International Economics, February 2001, 53(1), pp. 1-27. Kamin, Steven B.; Marazzi, Mario and Schindler, John W. “The Impact of Chinese Exports on Global Import Prices.” Review of International Economics, May 2006, 14(2), pp. 179-201.Prasad, Eswar S. and Rajan, Raghuram G. “Modernizing China’s Growth Paradigm.” American Economic Review, May 2006, 96(2), pp. 331-336.Rodrik, Dani. “What’s So Special about China’s Exports,” National Bureau of Economic Research Working Paper 11947, January 2006.Wayne, E. Anthony. “China’s Emergence as an Economic Superpower and Its Implications for U.S. Businesses.” Remarks at The Executives’ Club of Chicago, International Leadership Conference, Chicago, IL, May 25, 2005. http://www.state.gov/e/eb/rls/rm/2005/46950.htm.Wolf, Martin. “The Answer to Asia’s Rise is not to Retreat from the World.” Financial Times, March 15, 2006, p.17.

[관련키워드]


[뉴스핌 베스트 기사]
 사진
사진
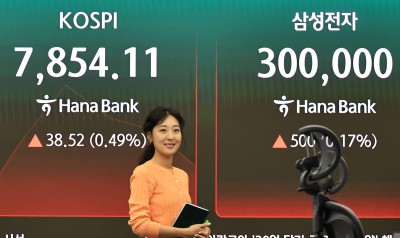
삼성전자 DS 성과급 1인 평균 6억
[서울=뉴스핌] 김정인 기자 = 삼성전자 노사가 반도체를 담당하는 디바이스솔루션(DS) 부문에 사업성과의 10.5%를 재원으로 하는 특별경영성과급을 신설하기로 잠정 합의했다. 지급 상한을 따로 두지 않기로 하면서 사업성과 산정 기준과 실제 실적에 따라 메모리사업부 임직원의 성과급이 연봉 1억원 기준 최대 6억원 안팎까지 늘어날 수 있다는 관측이 나온다.
21일 업계에 따르면 삼성전자와 초기업노동조합 삼성전자지부는 전날 '2026년 성과급 노사 잠정 합의서'에 서명했다. 합의안은 기존 초과이익성과급(OPI) 제도를 유지하면서 DS부문에 별도의 특별경영성과급을 신설하는 내용을 담고 있다.
[수원=뉴스핌] 류기찬 기자 = 김영훈 고용노동부 장관(가운데), 최승호 삼성전자 노조 공동투쟁본부 위원장(오른쪽), 여명구 삼성전자 디바이스솔루션(DS) 피플팀장이 20일 오후 경기 수원시 장안구 경기지방고용노동청에서 열린 삼성전자 노사교섭 결과 브리핑에서 손을 맞잡고 있다. 2026.05.20 ryuchan0925@newspim.com
특별경영성과급 재원은 노사가 합의해 선정한 사업성과의 10.5%로 정했다. 지급률 상한은 두지 않는다. 성과급 재원 배분은 DS부문 전체 기준 40%, 사업부 기준 60%로 나눠 이뤄진다. 공통 조직 지급률은 메모리사업부 지급률의 70% 수준으로 정했다.
◆ 상한 없어진 DS 보상…메모리 직원 6억 가능성
이번 합의안의 핵심은 성과급 상한 폐지다. 기존 OPI는 연봉의 최대 50%까지 지급되는 구조였지만, 새로 도입되는 DS부문 특별경영성과급은 지급 한도를 두지 않는다.
사업성과를 영업이익으로 가정할 경우 메모리사업부 임직원에게 돌아가는 성과급 규모는 크게 늘어날 수 있다. 올해 삼성전자의 영업이익 전망치를 300조원 안팎으로 놓고 계산하면, DS부문 특별경영성과급 재원은 약 31조5000억원 규모가 된다.
이 가운데 40%인 약 12조6000억원은 DS부문 전체 임직원에게 배분된다. DS부문 임직원 수를 약 7만8000명으로 보면 사업부와 관계없이 1인당 약 1억6000만원이 돌아가는 구조다.
나머지 60%인 약 18조9000억원은 사업부별 성과에 따라 배분된다. 파운드리와 시스템LSI 등 비메모리 사업부가 적자로 인해 사업부 배분에서 제외된다고 가정할 경우, 이 재원은 메모리사업부(약 2만8000명)와 공통 조직(약 3만명)에만 돌아가게 된다. 노사가 합의한 '1 대 0.7'의 지급률 비율을 적용해 계산하면, 메모리사업부 임직원은 1인당 약 3억8000만원, 공통 조직은 약 2억7000만원을 추가로 받게 되는 구조다.
메모리사업부 임직원이 기존 OPI로 연봉의 50%를 받을 경우 연봉 1억원 기준 약 5000만원이 더해진다. 이 경우 특별경영성과급과 OPI를 합친 총 성과급은 1인당 최대 6억원 안팎까지 늘어날 수 있다.
다만 이는 사업성과를 영업이익으로 가정한 계산이다. 합의서상 사업성과 산정 기준이 최종적으로 어떻게 정해지는지, 실제 실적이 어느 수준에서 확정되는지에 따라 지급액은 달라질 수 있다.
◆ 적자 사업부도 보상…2027년부터 차등 적용
비메모리 등 적자 사업부도 일정 수준의 성과급을 받을 수 있다. 합의안에 따르면 적자 사업부는 부문 재원을 활용해 산출된 공통 지급률의 60%를 적용받는다. 다만 이 기준은 1년 유예돼 2027년분부터 적용된다.
올해는 적자 사업부에도 DS부문 공통 배분 재원에 따른 성과급이 지급될 가능성이 있다. 사업성과를 영업이익으로 가정한 계산에서는 비메모리 부문 임직원도 최소 1억6000만원가량의 성과급을 받을 수 있다는 분석이 나온다.
특별경영성과급은 현금이 아닌 자사주로 지급된다. 세후 금액 전액을 자사주로 주고, 지급 주식의 3분의 1은 즉시 매각할 수 있다. 나머지 3분의 1씩은 각각 1년, 2년간 매각이 제한된다.
DS부문 특별경영성과급 제도는 향후 10년간 적용된다. 2026년부터 2028년까지는 매년 DS부문 영업이익 200조원 달성, 2029년부터 2035년까지는 매년 DS부문 영업이익 100조원 달성이 조건이다.
임금 인상률은 평균 6.2%로 정해졌다. 기본인상률 4.1%, 성과인상률 평균 2.1%를 합친 수치다. 노사는 사내주택 대부 제도 도입과 자녀출산경조금 상향에도 합의했다. 자녀출산경조금은 첫째 100만원, 둘째 200만원, 셋째 이상 500만원으로 오른다.
DX부문과 CSS사업팀에는 상생협력 차원에서 600만원 상당의 자사주를 지급하기로 했다. 협력업체 동반성장을 위한 재원 조성 및 운영 계획도 별도로 발표할 예정이다.
다만 잠정 합의안이 최종 확정된 것은 아니다. 노조는 조합원 찬반투표를 거쳐 합의안 수용 여부를 결정할 예정이다. 찬반투표에서 과반 찬성이 나오면 임금협약은 최종 타결된다.
kji01@newspim.com
2026-05-21 07:45
 사진
사진
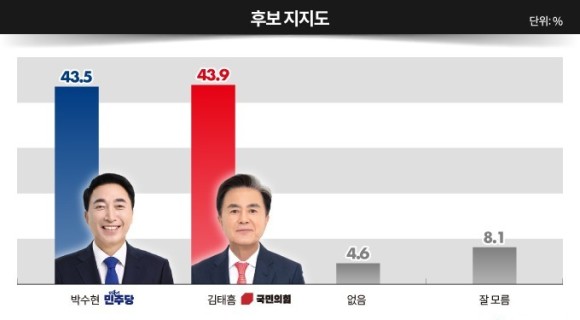
박수현 43.5% vs 김태흠 43.9%
[서울=뉴스핌] 송기욱 기자 = 6·3 지방선거 충남지사 선거에 출마한 박수현 더불어민주당 후보와 김태흠 국민의힘 후보가 오차 범위 내 초접전을 벌이고 있는 것으로 조사됐다.
또 충남 도민 10명 중 8명 이상이 이번 지방선거에 투표하겠다는 의향을 밝혔다.
◆ 박수현 43.5% vs 김태흠 43.9%...오차 범위 내 0.4%p 초접전
종합뉴스통신사 뉴스핌 의뢰로 여론조사 전문기관 리얼미터가 지난 18일부터 19일까지 충남 거주 만 18세 이상 남녀 806명을 대상으로 실시한 충남지사 후보 지지도 조사 결과 박수현 후보 43.5%, 김태흠 후보 43.9%였다. 두 후보 간 격차는 0.4%p(포인트)로 오차 범위 안이다. '없음'은 4.6%, '잘 모름'은 8.1%였다.
지역별로는 김 후보가 천안시에서 45.0%를 기록해 박 후보(42.7%)보다 높게 조사됐다. 서남권(보령시·서산시·서천군·예산군·태안군·홍성군)에서도 김 후보는 48.8%로 박 후보(39.2%)보다 높았다.
반면 박 후보는 아산·당진시에서 47.1%를 기록하며 김 후보(37.5%)에 우세했고, 동남권(공주시·논산시·계룡시·금산군·부여군·청양군)에서도 46.0%로 김 후보(43.2%)를 웃돌았다.
연령별로는 김 후보가 만 18~29세에서 40.8%를 기록해 박 후보(31.5%)보다 높았다. 60대에서도 김 후보는 53.5%로 박 후보(41.2%)보다 높았고, 70세 이상에서는 김 후보 61.3%, 박 후보 26.9%였다.
반면 박 후보는 30대에서 40.2%로 김 후보(39.2%)를 소폭 웃돌았다. 40대에서는 박 후보 61.7%, 김 후보 29.2%였고, 50대에서는 박 후보 56.3%, 김 후보 36.0%로 크게 앞섰다.
성별로는 남성층에서 김 후보가 47.1%를 기록해 박 후보(44.1%)보다 높았다. 여성층에서는 박 후보 42.8%, 김 후보 40.5%였다.
정당 지지층별로는 집권 여당인 더불어민주당 지지층의 84.6%가 박 후보를 지지한다고 답했다. 제1야당인 국민의힘 지지층의 89.4%는 김 후보를 택했다. 조국혁신당 지지층에서는 박 후보 64.5%, 김 후보 24.0%였다. 개혁신당 지지층에서는 김 후보 48.5%, 박 후보 31.0%였다.
투표 의향별로는 '반드시 투표하겠다'는 적극 투표층에서 박 후보가 48.8%로 김 후보(45.2%)보다 높았다. 반면 투표 의향층 전체에서는 김 후보 46.2%, 박 후보 43.8%였다. 투표 의향이 없다는 응답층에서는 박 후보 44.6%, 김 후보 27.7%였다.
◆ 충남도민 83.7% "지방선거 투표하겠다"
투표 의향은 83.7%가 투표하겠다고 답했다. '반드시 투표' 66.1%, '가급적 투표' 17.7%였다. 반면 '별로 투표할 생각 없음' 6.0%, '전혀 투표할 생각 없음' 8.0%였다.
권역별 투표 의향은 동남권 85.4%, 서남권 84.1%, 천안시 83.6%, 아산·당진시 82.3%였다. 전 권역에서 투표 의향층은 80%를 넘었다.
연령별로는 60대가 91.3%로 가장 높았고, 50대 89.7%, 70세 이상 88.9%, 40대 88.3% 순이었다. 뒤이어 30대는 72.5%, 만 18~29세 63.1%였다.
이번 여론조사는 휴대전화 가상(안심)번호를 무작위로 추출해 자동응답조사(ARS)방식으로 진행됐다. 표본오차는 95% 신뢰수준에 ±3.5%p, 응답률은 8.2%다. 2026년 4월 말 행정안전부 주민등록 인구를 기준으로 성별, 연령별, 지역별 가중치(림가중)를 적용했다. 자세한 사항은 중앙선거여론조사심의위원회 홈페이지를 참조하면 된다.
oneway@newspim.com
2026-05-21 05:00